

What is PSL? How Credora measures DeFi risk
APY tells you how much a vault pays when conditions are stable. Probability of Significant Loss (PSL) tells you how often, under historical market conditions, a depositor loses more than 1% of principal. Both numbers belong in the same evaluation. DeFi currently shows only one of them.
PSL is Credora’s core risk metric for DeFi lending markets. It drives the letter grade on the A+ to D rating scale.
What PSL measures
PSL is the annualized probability that a depositor loses more than 1% of principal in a given lending market over a one-year horizon. The 1% threshold is Credora’s definition of significant loss: a level of capital impairment that a depositor with a principal-preservation mandate cannot absorb without consequence.
The metric answers a specific question: not how much could go wrong in the worst case, but how often, across the full distribution of historical market conditions, does a lending market produce a loss that exceeds this threshold.
A PSL of 1% means that in 1 out of 100 simulated years, under historical market conditions, a depositor would have experienced a loss exceeding 1% of principal. A PSL of 8% means this outcome occurred in 8 out of 100 simulated years. The difference in letter grade between an A-rated and a B-rated vault reflects a difference in this probability.
How PSL is calculated
PSL is the output of a Monte Carlo simulation. Each lending market runs through 100,000 scenarios drawn from the historical distribution of collateral price movements, liquidity conditions, oracle behavior, and correlated market shocks. The PSL is the proportion of simulations where the loss exceeds 1% of principal.
This differs from single-point estimates or deterministic stress tests in two ways. First, it produces a probability distribution rather than a single worst-case number, so the output reflects the full range of historical market behavior, not just the analyst’s chosen scenario. Second, 100,000 simulations capture tail dependencies (situations where multiple risk factors move adversely together) that deterministic models typically miss.
The inputs are sourced from onchain data: transaction history, liquidation dynamics, collateral price history, and oracle behavior across market cycles. This is the primary distinction from traditional credit risk frameworks, which rely on disclosed financials and legal enforceability. Historical DeFi exploit data is one reference source for calibrating tail loss probabilities in scenarios that have no analog in credit markets.
What PSL ranges mean in practice
PSL maps to a letter grade on Credora’s A+ to D scale. Each grade corresponds to a defined PSL range.
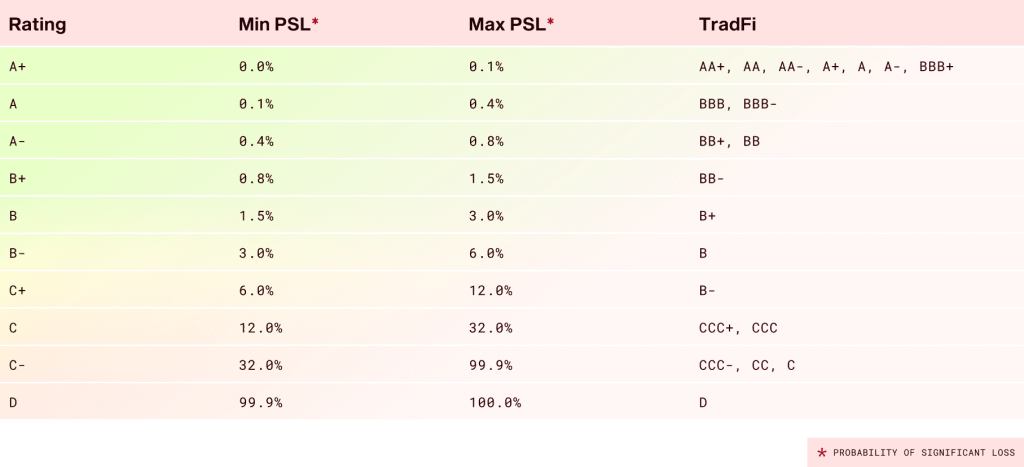
An A+ rating represents the lowest PSL tier: markets where historical simulations produce significant loss outcomes in very few scenarios. Collateral is liquid, marks to market accurately, and the smart contract has an extended track record. An A+ vault is not a zero-risk vault. PSL is a probability, not a guarantee. But the probability is low enough to support principal-preservation mandates.
A B-rated vault carries a higher PSL, reflecting moderately liquid collateral, some oracle concentration risk, or a smart contract with less production history. Yield is typically higher than on an A-rated vault, reflecting the additional risk the depositor absorbs.
A D-rated vault sits at the highest PSL tier, typically reflecting illiquid collateral with model-based valuation, a fixed-price oracle that cannot adjust in a stress event, or a smart contract with limited audit history.
The letter grade makes comparison possible across structurally different markets. A depositor evaluating a tokenized T-bill vault alongside a private credit vault cannot compare them meaningfully using APY or TVL. PSL provides a common unit.
PSL and probability of default
PSL is the DeFi equivalent of probability of default (PD) in traditional credit analysis. PD measures the likelihood that a borrower fails to meet its contractual obligations over a defined horizon. PSL applies the same logic to a lending market: the likelihood that the market fails to preserve depositor capital above the 1% threshold over a one-year period.
The calibration uses 30+ years of historical credit cycle data as a reference point, mapping DeFi market behavior to established default frequency distributions. This allows PSL to be interpreted on a scale familiar to institutional allocators who use PD as a standard input in credit portfolio construction.
Key takeaway
PSL is the annualized probability that a DeFi lending market produces a loss exceeding 1% of principal, calculated across 100,000 simulated scenarios. It translates collateral quality, oracle design, smart contract risk, and liquidity into a single comparable number. The letter grade on Credora’s A+ to D scale maps directly to PSL ranges. See What is a DeFi risk rating? for the full framework PSL sits within.
Frequently asked questions
What does a PSL of 2% mean for a depositor?
A PSL of 2% means that in 2 out of 100 simulated years, under historical market conditions, a depositor would have experienced a loss exceeding 1% of principal. It does not mean 2% of capital is at risk. It means the probability of a significant loss event in a given year is 2%.
How is PSL different from APY?
APY measures the return a vault pays when conditions are stable. PSL measures the probability that conditions become unstable enough to produce a significant capital loss. The two metrics are independent: a vault with high APY can carry low PSL, or high PSL. APY describes expected return. PSL describes downside probability.
Does a higher rating always mean lower yield?
Not necessarily, but there is a general relationship. Higher-rated vaults tend to hold more liquid collateral with well-matched oracles, which reduces both PSL and the risk premium in yield. Lower-rated vaults typically offer higher APY to compensate for additional risk. Comparing yield across vaults without comparing PSL is an incomplete analysis.
Ratings and data provided are for informational purposes only. Not investment advice or a solicitation to buy or sell assets. Always conduct your own due diligence. Credora does not guarantee the completeness or real-time accuracy of any information provided. A full disclaimer is included in each risk assessment report published at reports.credora.network.