DeFi Rating Scale
Credora methodologies produce one of two risk measures depending on the product. Asset methodologies output a Probability of Default (PD), the likelihood the asset fails its core redemption or reserve commitments. Product methodologies (loan pairs, vaults, and pools) output a Probability of Significant Loss (PSL), the annualized probability of a loss of 1% or more of principal. Both are expressed on the same Credora PD Curve, which is what allows a single rating scale to compare a stablecoin against a vault against a lending market.
Because the DeFi Rating Scale defines each rating as a PD range rather than a single point, the Score is derived from a representative PD within each rating band (the band midpoint). The mapping is therefore consistent across every asset, market, and vault output that resolves to the same rating.
Scores near the top of the range signal minimal expected loss (the A band), the middle of the range corresponds to moderate risk (the B band), and Scores toward the lower end indicate speculative-grade risk (the C band and D), broadly in line with the TradFi equivalences shown in the rating table. As with any widely used rating scale, the Score communicates relative risk rather than an absolute probability, which is more precisely captured by the PD band itself.
All Credora ratings are displayed in the Credora Rating Scale, a single, quantitative standard for comparing exposure across protocols, assets, markets and vaults:
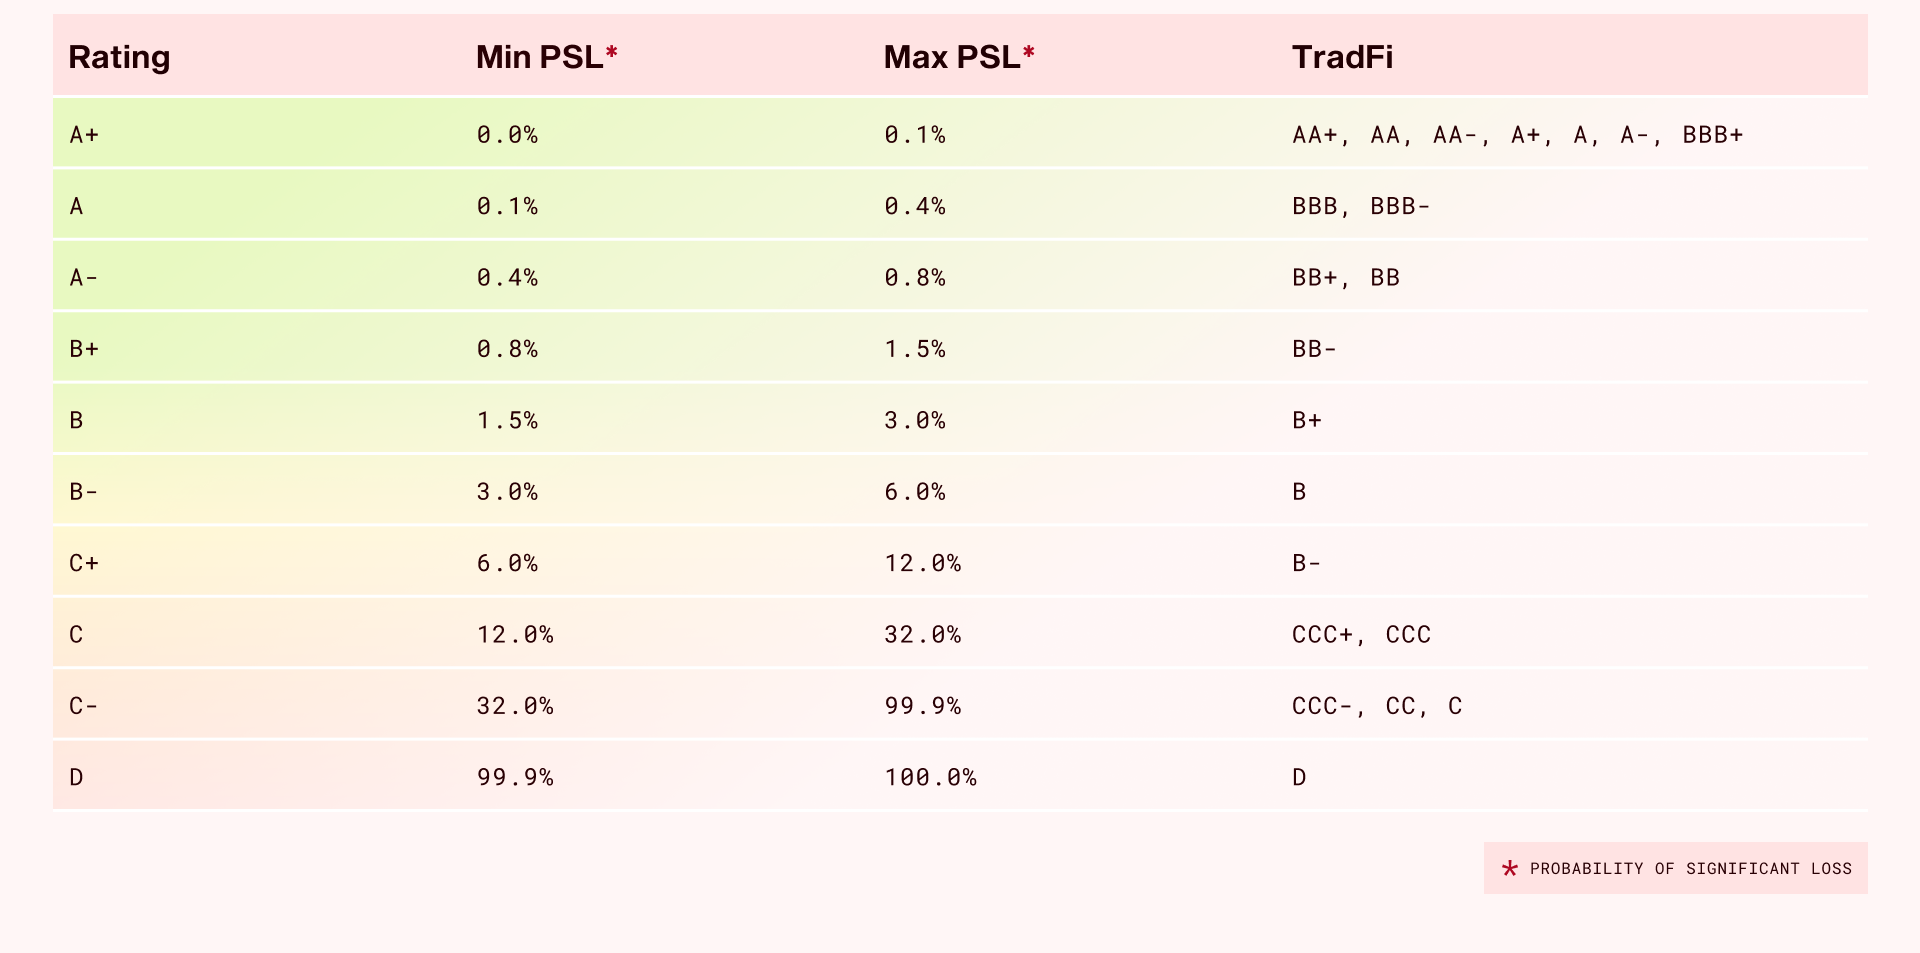
Probability of Significant Loss (PSL) is an annualized probability of a product to experience a loss of 1% or more of principal. PSL is expressed as a percentage and serves as the quantitative basis for Credora's DeFi Rating Scale. A lower PSL indicates a lower likelihood of meaningful capital impairment within a given year.
The rating scale is designed to maximize differentiation across DeFi products while remaining easy to read and interpret. As benchmarks, stablecoins such as USDC are assigned an A+ rating, while as of the date of the document Morpho vaults and markets begin at an A rating.
Deriving the DeFi Rating Scale
All Credora methodologies rely on the Credora PD Curve, a uniform underlying probability of default curve. The curve fundamentally enables a comparison of risk across various Credora methodologies (Assets, Lending Markets, Vaults etc.) and enables direct comparisons between Credora ratings and credit ratings assigned by traditional rating agencies. Traditional rating agency ratings scales are widely ingrained in the financial system and recognized by institutions and individual market participants. The Credora PD Curve is derived from analysis of the historic realized defaults across debt issuances rated by major US ratings agencies, including S&P, Moody’s, and Fitch.
Calculation
Credora starts by comparing the one-year global historical default rates by the three major credit agencies for each rating tier. The underlying data set spans at minimum 1990 to 2023, and therefore includes different credit cycles. Although the rating scale designations differ slightly across ratings agencies, Credora normalizes them on a single rating scale. Average default rates across major agency rated issuers and issuances are calculated for each rating tier, and a curve is interpolated. The image below shows the Credora PD Curve and the three rating agencies' historic realized default rates.
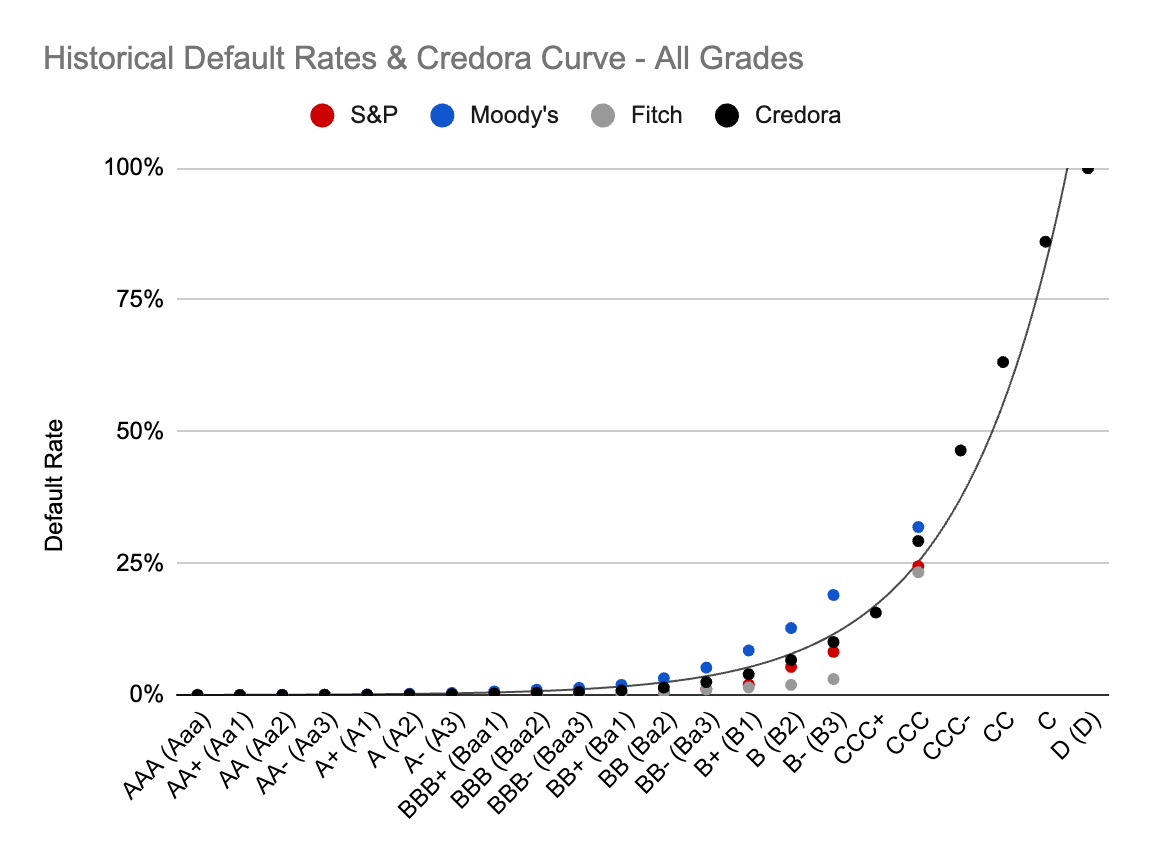
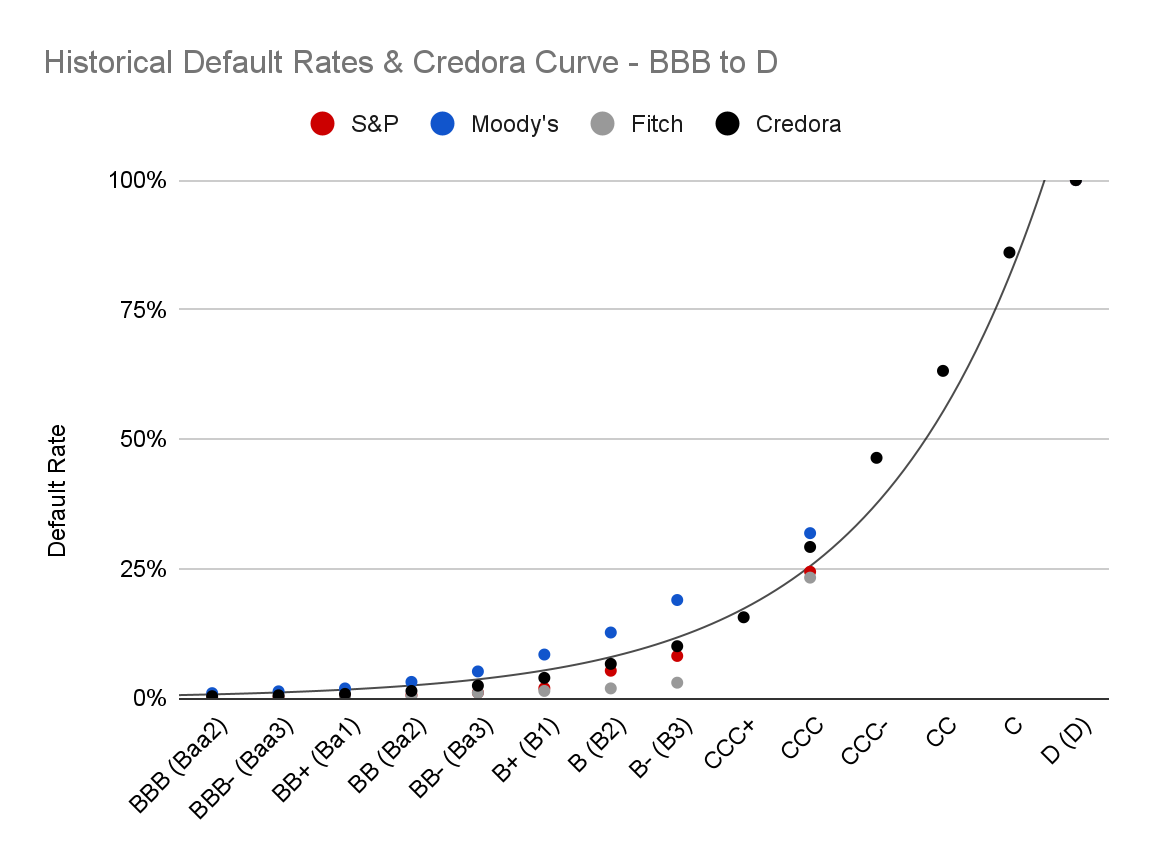
Credora uses exponential interpolation to define a function for the curve equation. The objective is to fit the data to an exponential model of the form , where y is the value at observation x, a is a scaling factor, and b represents the growth rate, fitted to the data points. Because agencies combine the realized C, CC and CCC default rates in aggregate, an intermediate exponential interpolation is used to obtain the points for CCC+, CCC-, CC and C. Based on this formula, the Defi Ratings Table provides a discretized version of the Credora PD Curve. The PD ranges are optimized to enhance risk differentiation within the portion of the curve where the majority of the DeFi landscape operates.
Anchor and Final PD/PSL
All Credora methodologies share a common core: the determination of an Anchor PD and the application of Modifiers. The Anchor PD quantifies the foundational, or base, risk of an asset, and Modifiers are applied as adjustments to it. For any specific asset, issuer, or debt issuance, the analysis typically draws on sub-methodologies. Sub-methodologies may themselves have Anchor PD and Modifier components, with the output of one feeding in as the Anchor PD input to the next. In other words, the methodology structure is nested.
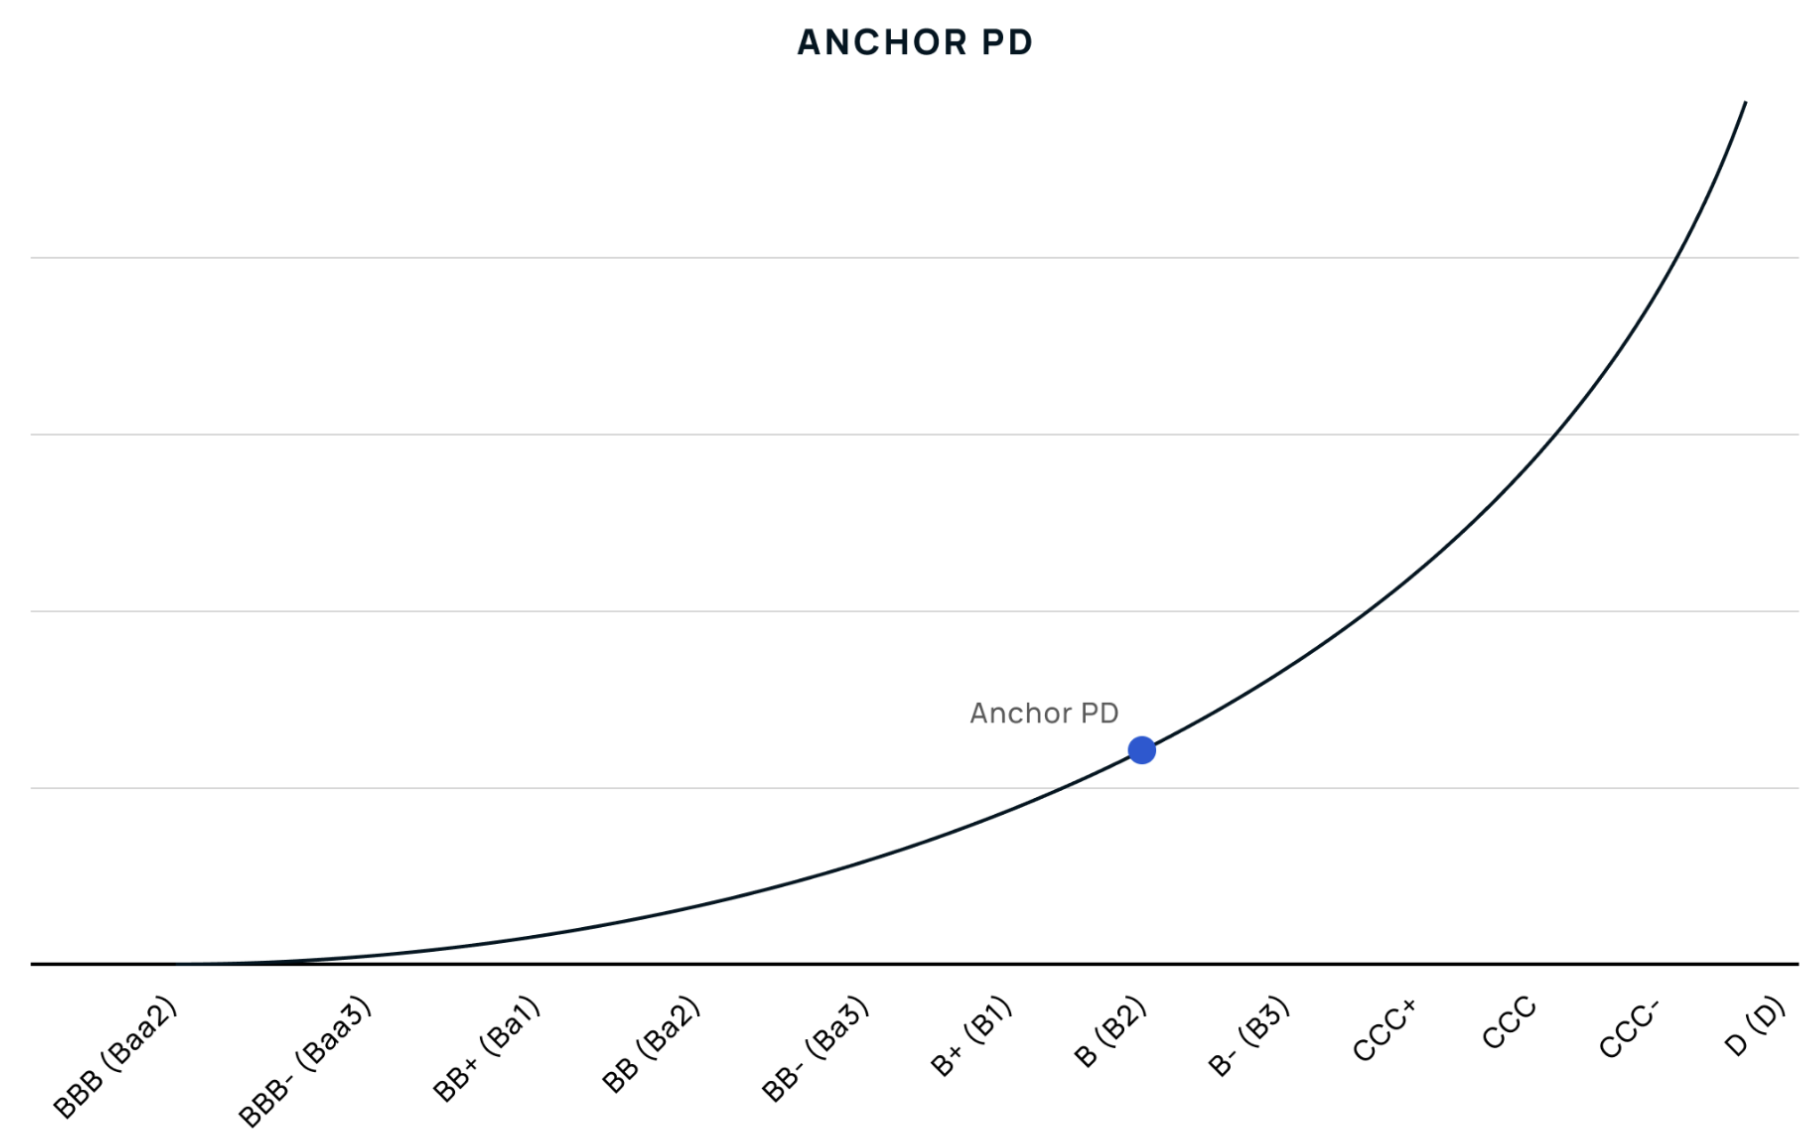
Modifiers are applied as notch adjustments along the Credora PD Curve. They capture risks that are not already reflected in the Anchor PD. A single notch corresponds to one step along the curve, and is either a positive adjustment (lower PD) or a negative adjustment (higher PD). Applying the Modifiers produces a Final PD, which maps to an implied rating on the DeFi Rating Scale.
- Anchor PD — defines the starting point on the Credora PD Curve.
- Positive Notch — a left shift along the curve, corresponding to a decrease in PD.
- Negative notch — a right shift along the curve, corresponding to an increase in PD.
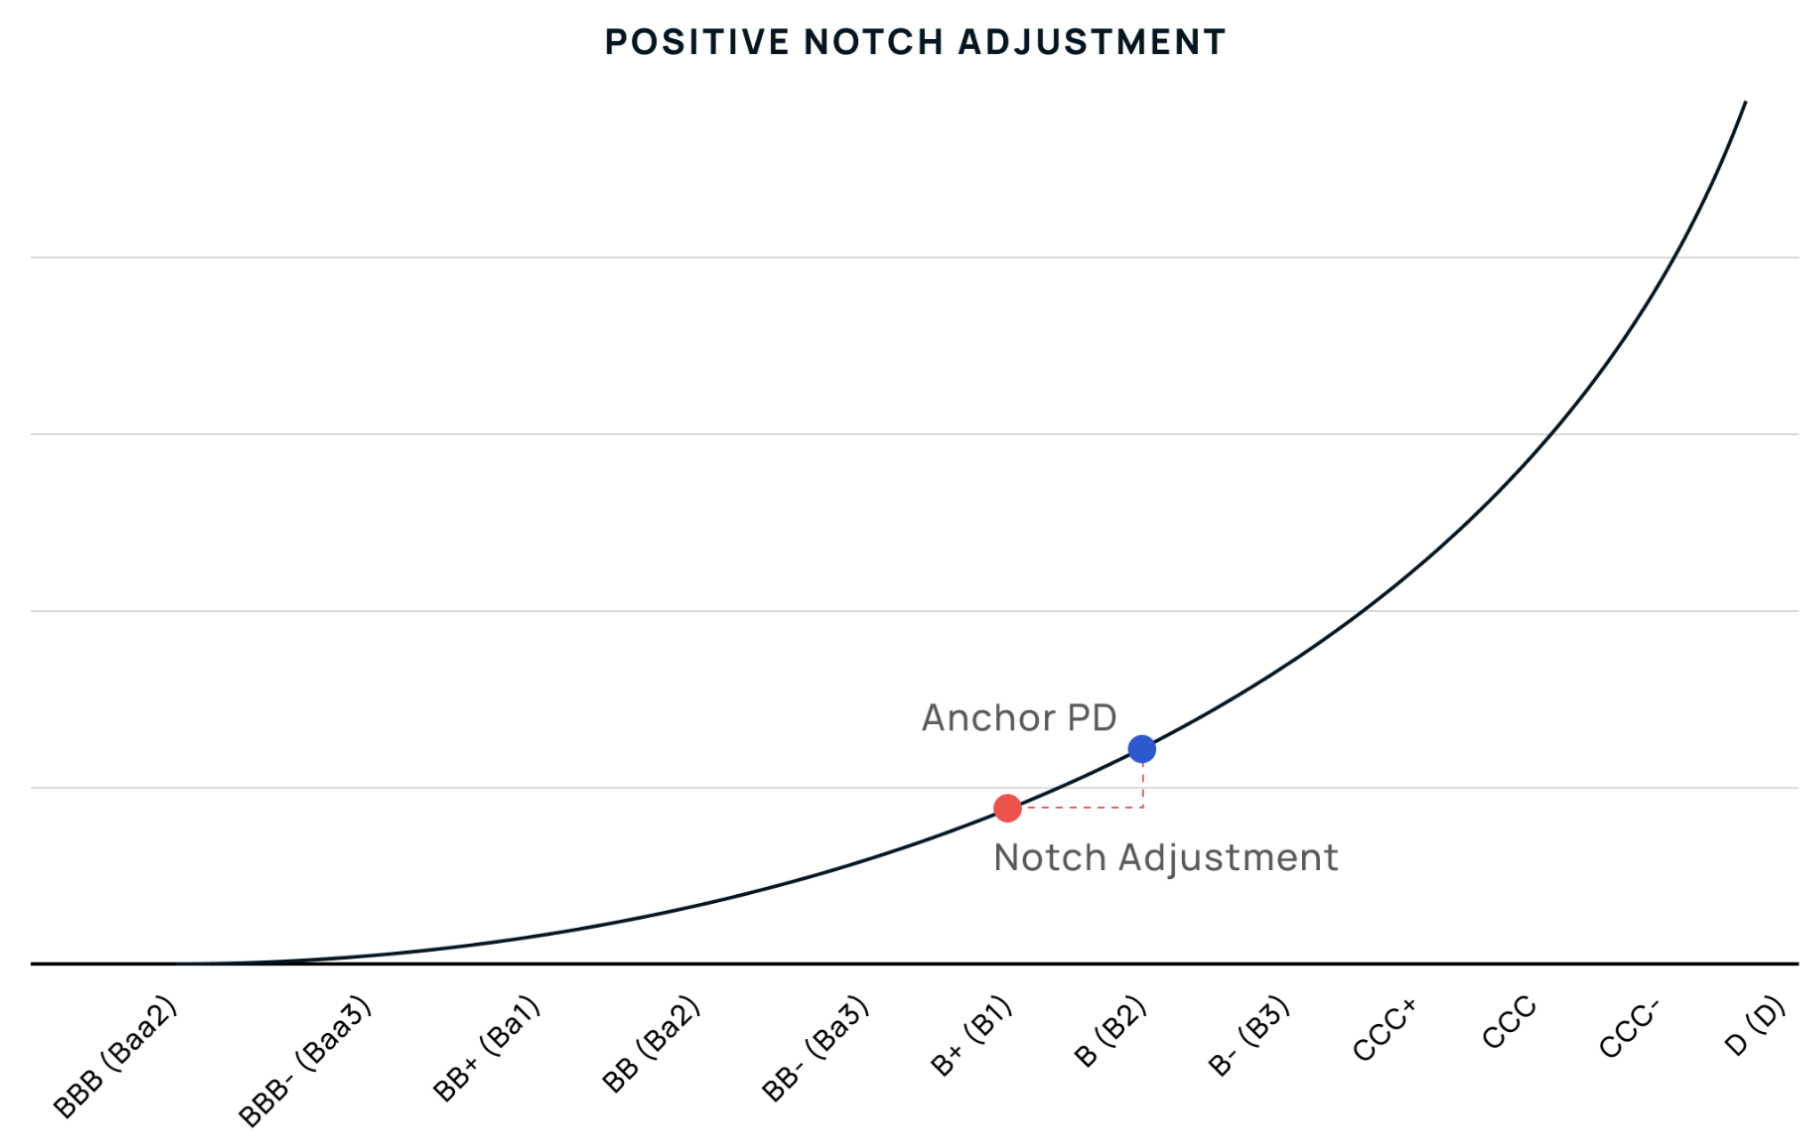
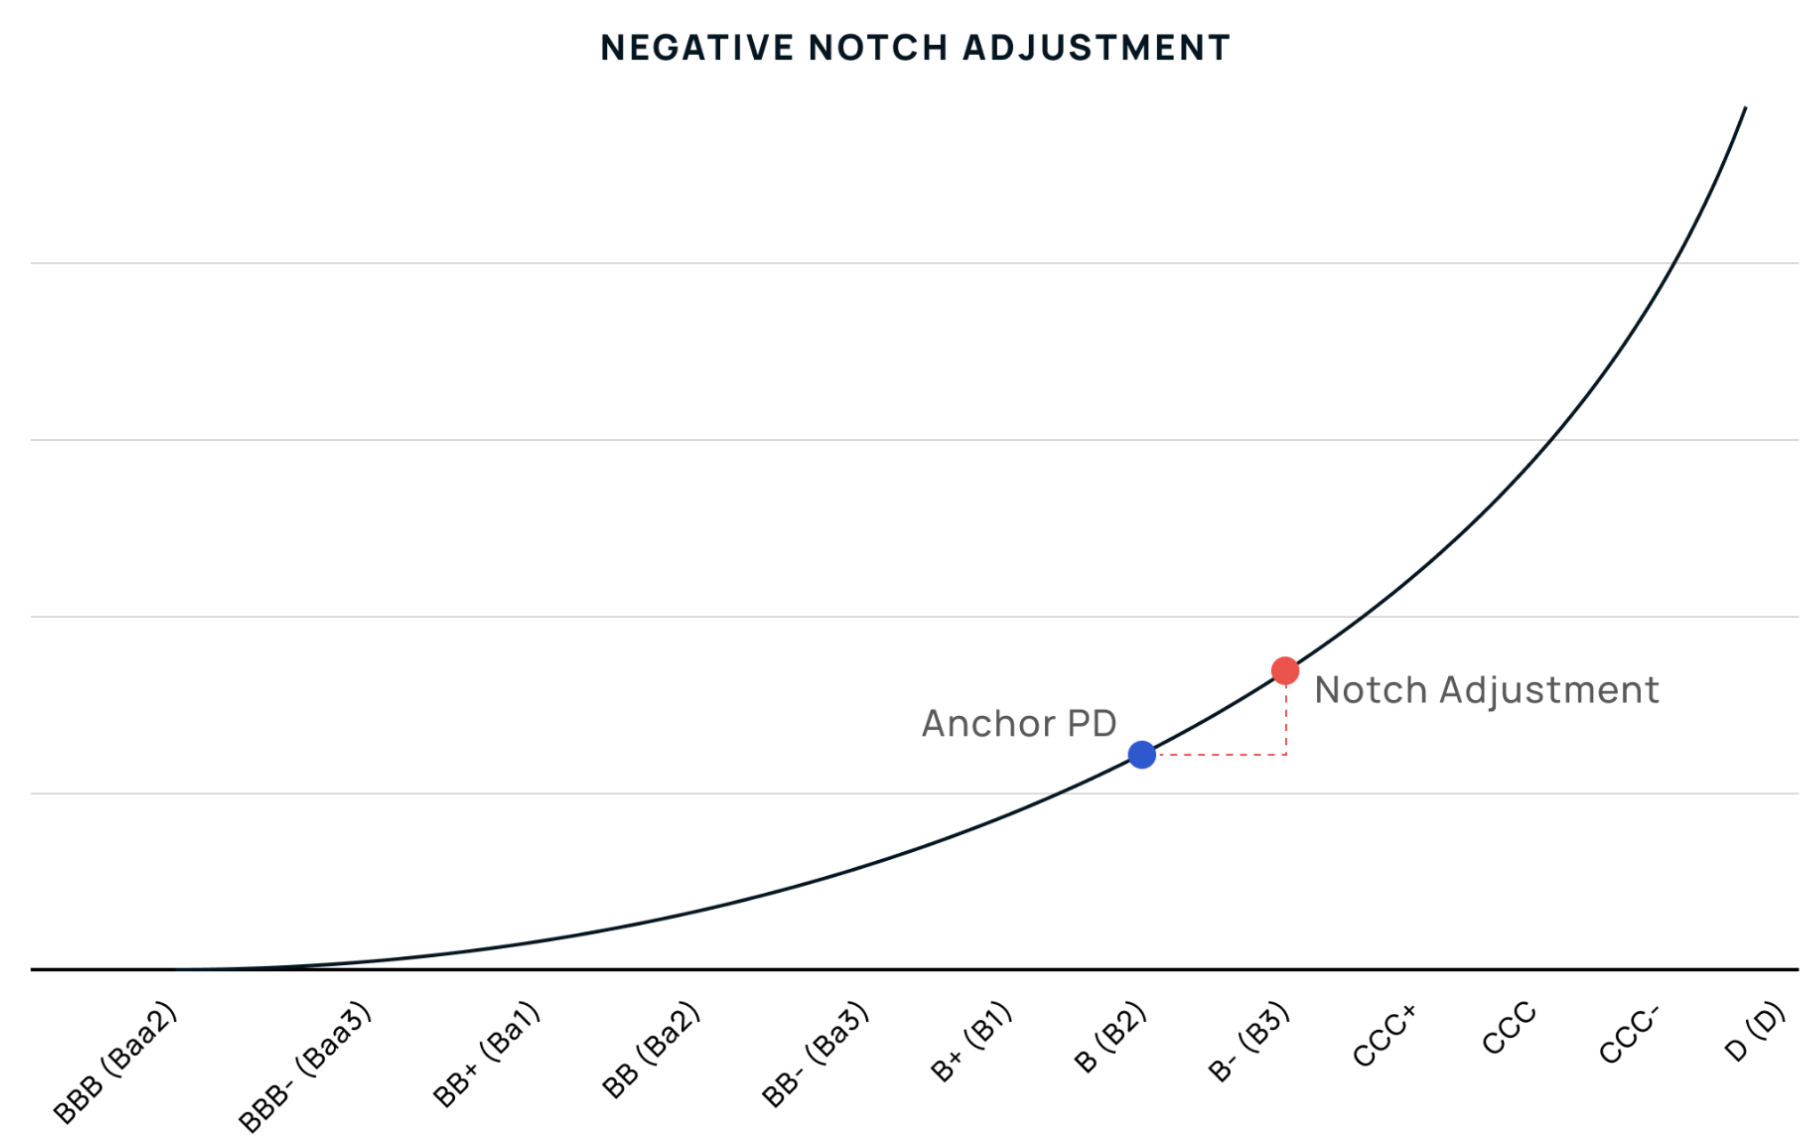
This structure adopts best practices from the major rating agencies, which similarly use anchor-and-modifier logic as a core concept.
Anchor PD/PSL Determination
The Anchor PD/PSL is the starting point for quantifying the probability of default of a given asset, issuer, or debt issuance. Each sub-methodology focuses on the primary risk characteristics relevant to that asset type and grounds the Anchor PD/PSL in empirical evidence.
Examples across methodologies:
- Fiat-backed stablecoins: the Anchor PD is derived from Asset Quality (the risk of the reserves themselves) and Counterparty Risk (the risk of the entities custodying those reserves).
- Loan pairs: the Anchor PSL is a result of Monte Carlo simulation on the market level
- Vaults: the Anchor PSL is derived by evaluating each underlying market's probability of independently causing a vault-level breach, combining default probability with LGD relative to allocation size
Modifier Determination
Modifiers refine the assessment by capturing risk variables that the Anchor PD does not already reflect. Applying them as adjustments lets the methodology express each variable's relative impact on risk, measured from the baseline the Anchor PD establishes.
Modifiers are selected, organized, and analyzed as follows:
- Selection: modifiers are chosen using peer-group analysis, academic and industry research, and stakeholder feedback.
- Organization: modifiers are grouped thematically, so the combined effect of those addressing a particular dimension of risk can be understood together.
- Validation: modifiers are tested for multicollinearity to identify and resolve explanatory overlap.
Notch Adjustments
The size of a notch adjustment for a given modifier is set in one of two ways: (i) a quantitative input is mapped through a scoring curve that translates it into a notch adjustment, or (ii) a table selection is made that corresponds to a specific notch adjustment.
Credora calibrates the magnitude of each modifier by how well it differentiates comparable tokens. The underlying curves and tables are refined over time as new information allows for increasingly accurate parameterization.